Turf Advisor - Managing Microdochium - 2025 Autumn update

Microdochium patch (Microdochium nivale) remains the primary threat to turf quality in the UK – resulting in widespread loss of surface quality. 

After this season's exceptionally hot and dry summer, a return to more normal heavy rain downpours and intermittent periods of cool and warm weather, create the perfect storm of high disease pressure - just as conditions start to limit turf growth for recovery.

As day length shortens and prolonged periods of overnight leaf wetness increases, so the pressure will continue to build.   

Outbreaks can occur at any time, but are most common, and typically more severe, during the autumn and winter, whenever the weather is relatively mild and moist, particularly where leaves remain wet for a prolonged period of time. 

Syngenta Turf Advisor gives an early warning of local conditions where infection may have occurred in recent days, along with a forecast of what is likely to hit over coming days – in time to support your decisions and take preventative action.  


Find out more about Turf Advisor, or download from the links below
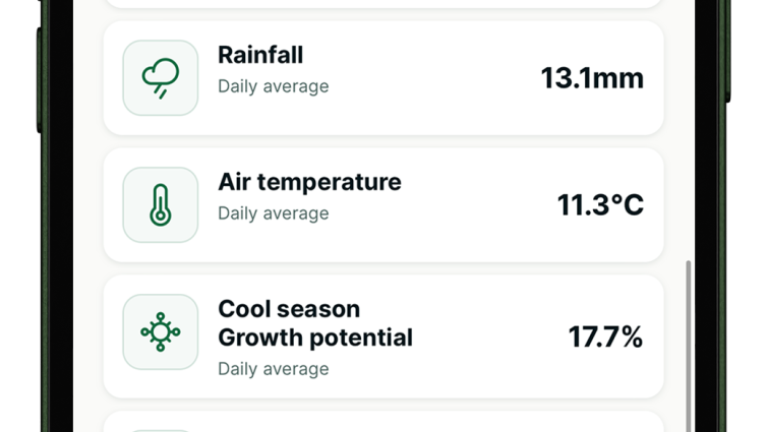
 

Turf Advisor dashboard set up for microdochium seasonWhen the risk of microdochium rises in autumn you can set up a profile in your App to select key metrics that will influence disease development. During the profile set up you can drag and drop the metrics into a bespoke order. 

Turf Advisor dashboard set up for microdochium season

When the risk of microdochium rises in autumn you can set up a profile in your App to select key metrics that will influence disease development. During the profile set up you can drag and drop the metrics into a bespoke order. 

GreenCast microdochium modelThe microdochium model uses a combination of rainfall and temperature to calculate risk of disease development. The risk is ranked from 0 (low) to 4 (High). Compare recent days and forecast with the current two-week average with long term trend.
GreenCast microdochium model

The microdochium model uses a combination of rainfall and temperature to calculate risk of disease development. The risk is ranked from 0 (low) to 4 (High). Compare recent days and forecast with the current two-week average with long term trend.

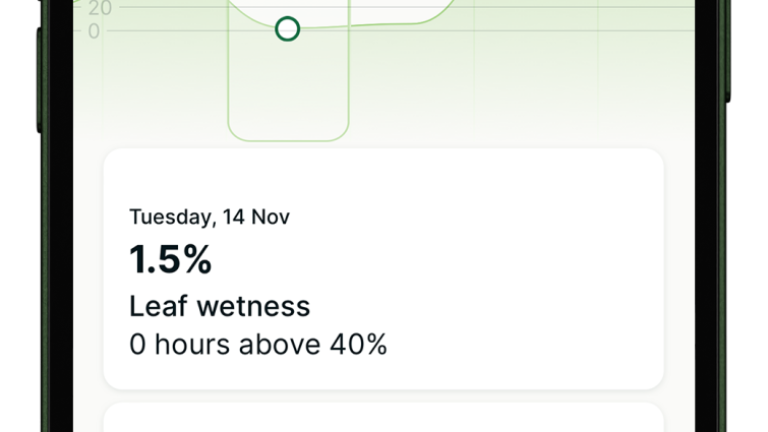
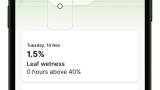
Leaf wetnessWet leaves from dew or rain encourage disease development. A valuable measure to influence ITM actions to improve air flow. Shown as an avergae %. Look out for prolonged hours above 40% leaf wetness. Review recent days and forecasts.

Leaf wetness

Wet leaves from dew or rain encourage disease development. A valuable measure to influence ITM actions to improve air flow. Shown as an avergae %. Look out for prolonged hours above 40% leaf wetness. Review recent days and forecasts.

HumidityHumidity is one of the biggest drivers for microdochium and in the UK and Ireland. Low humidity breaks are unusual in autumn and winter. Use the humidity screen to validate disease pressure periods. Compare current days and forecasts with longer term trends.

Humidity

Humidity is one of the biggest drivers for microdochium and in the UK and Ireland. Low humidity breaks are unusual in autumn and winter. Use the humidity screen to validate disease pressure periods. Compare current days and forecasts with longer term trends.

RainfallOnce irrigation has stopped rainfall is a major driver of leaf wetness and humidity. It will also adversely impact on any chances for fungicide application and turf recovery. Watch recent days and forecast models.
Rainfall

Once irrigation has stopped rainfall is a major driver of leaf wetness and humidity. It will also adversely impact on any chances for fungicide application and turf recovery. Watch recent days and forecast models.

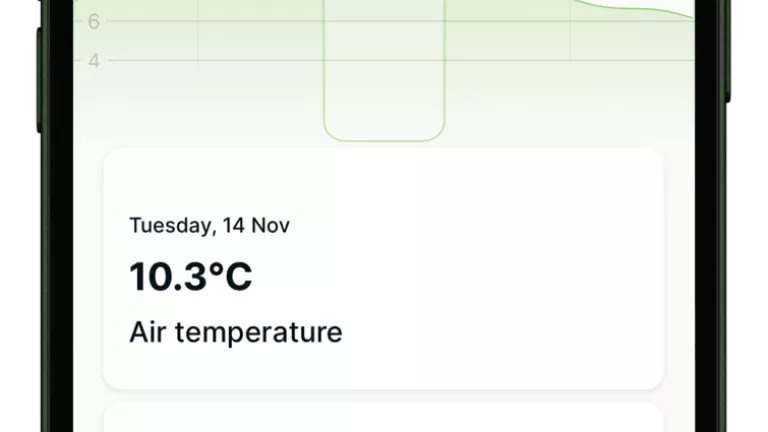
Air temperatureMicrodochium develops faster at higher temperatures, and will slow down or stop when temps drop below 0-1C. Highest risk is at 4-5C when disease developes but limited or no growth for healthy plant resilience or recovery.
Air temperature

Microdochium develops faster at higher temperatures, and will slow down or stop when temps drop below 0-1C. Highest risk is at 4-5C when disease developes but limited or no growth for healthy plant resilience or recovery.

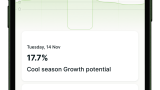
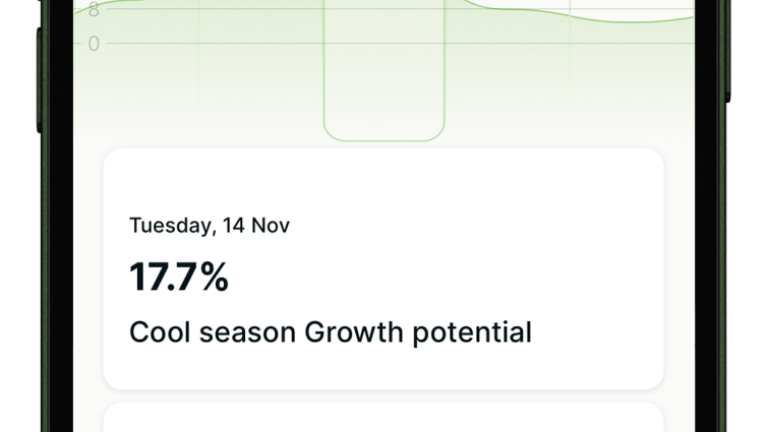
Growth PotentialExpressed as a % of a turf plant's ability for maximum growth, based on temperature. A useful trend metric to assess plant health and vigour. Be aware other stresses may impact on actual turf growth. 
Growth Potential

Expressed as a % of a turf plant's ability for maximum growth, based on temperature. A useful trend metric to assess plant health and vigour. Be aware other stresses may impact on actual turf growth. 

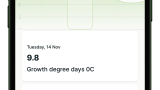
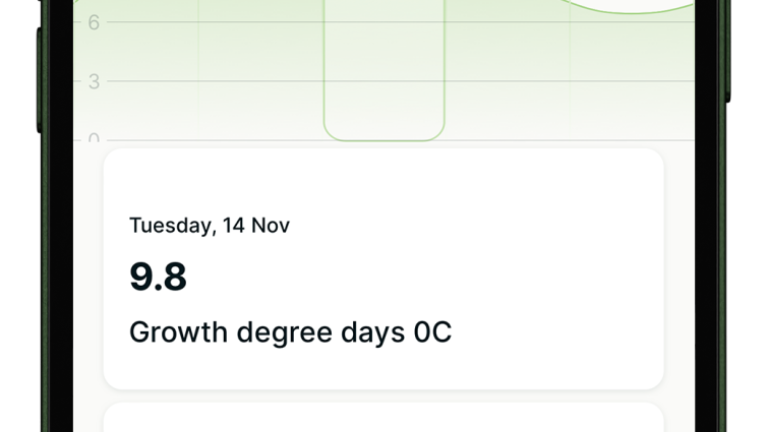
Growth Degree DaysUsed in conjunction with Growth Potential GDD is another good metric for potential plant vigour and natural resilience to microdochium infection. Look at recent 2 week average, and comparison to this season against previous years.

Growth Degree Days

Used in conjunction with Growth Potential GDD is another good metric for potential plant vigour and natural resilience to microdochium infection. Look at recent 2 week average, and comparison to this season against previous years.

Spray windowsUse spray windows to identify when you may be able to make preventative applications before periods of high disease risk. Hugely valuable to optimise spray timing. Use the i symbol to identify why issues may occur.

Spray windows

Use spray windows to identify when you may be able to make preventative applications before periods of high disease risk. Hugely valuable to optimise spray timing. Use the i symbol to identify why issues may occur.
Turf Advisor dashboard set up for microdochium seasonWhen the risk of microdochium rises in autumn you can set up a profile in your App to select key metrics that will influence disease development. During the profile set up you can drag and drop the metrics into a bespoke order. 
GreenCast microdochium modelThe microdochium model uses a combination of rainfall and temperature to calculate risk of disease development. The risk is ranked from 0 (low) to 4 (High). Compare recent days and forecast with the current two-week average with long term trend.
Leaf wetnessWet leaves from dew or rain encourage disease development. A valuable measure to influence ITM actions to improve air flow. Shown as an avergae %. Look out for prolonged hours above 40% leaf wetness. Review recent days and forecasts.
HumidityHumidity is one of the biggest drivers for microdochium and in the UK and Ireland. Low humidity breaks are unusual in autumn and winter. Use the humidity screen to validate disease pressure periods. Compare current days and forecasts with longer term trends.
RainfallOnce irrigation has stopped rainfall is a major driver of leaf wetness and humidity. It will also adversely impact on any chances for fungicide application and turf recovery. Watch recent days and forecast models.
Air temperatureMicrodochium develops faster at higher temperatures, and will slow down or stop when temps drop below 0-1C. Highest risk is at 4-5C when disease developes but limited or no growth for healthy plant resilience or recovery.
Growth PotentialExpressed as a % of a turf plant's ability for maximum growth, based on temperature. A useful trend metric to assess plant health and vigour. Be aware other stresses may impact on actual turf growth. 
Growth Degree DaysUsed in conjunction with Growth Potential GDD is another good metric for potential plant vigour and natural resilience to microdochium infection. Look at recent 2 week average, and comparison to this season against previous years.
Spray windowsUse spray windows to identify when you may be able to make preventative applications before periods of high disease risk. Hugely valuable to optimise spray timing. Use the i symbol to identify why issues may occur.
play_circle
Greencast Microdochium model - what have we learned so far?

How to use the microdochium model

Sean Loakes & Glenn Kirby explain how the GreenCast Microdochium Patch Model is calculated and how to use it in practice.

Download a dashboard cheat sheet

Download a copy of the Turf Advisor microdochium management 2024 cheat sheet for to set up your dashboard. Share it with the team and other turf managers

Integrated Turf Management practices to reduce microdochium pressure

Dry leaf surfaces

Reduce shade & improve air flow

Remove thatch

Reduce Poa annua content

Proactive fungicide applications

Find out more on microdochium patch ITM and control options here.

Download for Apple from the App store

Download for android from Google Play