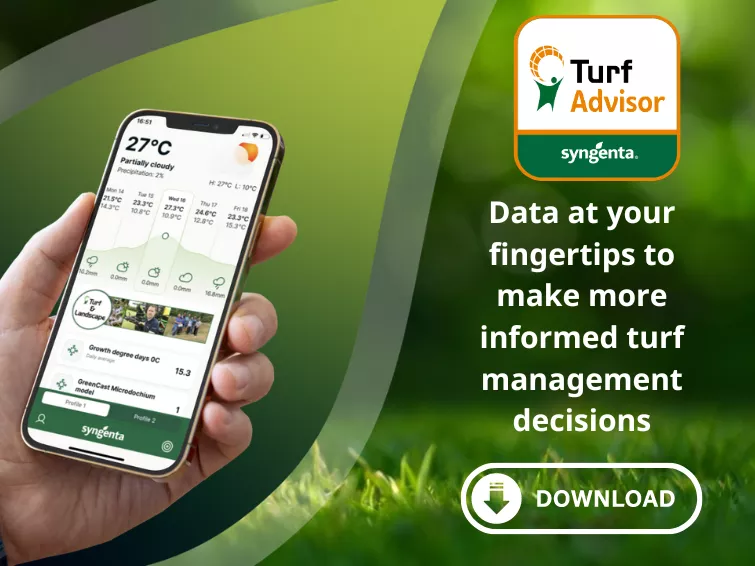
Dollar spot dashboard - the data to help your ITM decsions

Dollar spot outbreaks increasingly result in serious surface quality loss on greens, approaches and tees. Changing climatic conditions and Integrated Turf Management (ITM) practices are driving the severity of attacks.

Turf Advisor gives you the data to decide control strategies. Pick the appropriate Turf Advisor tools for your dashboard and prioritise their order, to better understand dollar spot risks and when to act.

 

dollar_spot_decsions_read_more_here.webp

Find out more about Turf Advisor, or download from the links below:
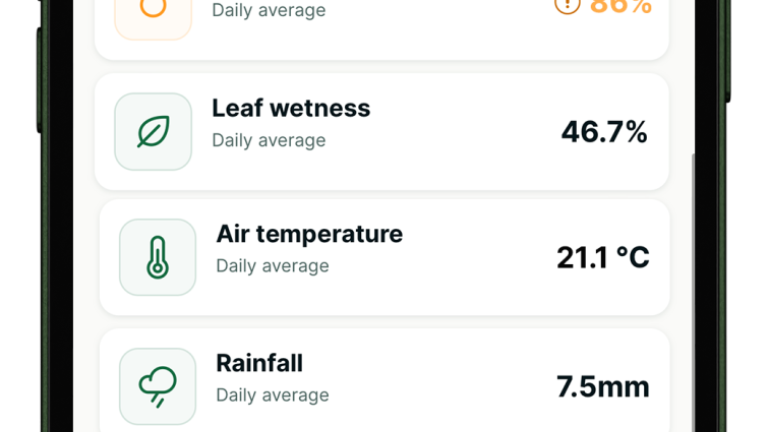
Dollar spot dashboardFind out how each of the data sets you can select influence dollar spot development and your decision making

Dollar spot dashboard

Find out how each of the data sets you can select influence dollar spot development and your decision making

HumidityHumidity is one of the key drivers for dollar spot outbreaks. You can set the risk threshold in Turf Advisor for 70% (medium) 80% (high), show in amber/red when the most challenging periods occur.
Humidity

Humidity is one of the key drivers for dollar spot outbreaks. You can set the risk threshold in Turf Advisor for 70% (medium) 80% (high), show in amber/red when the most challenging periods occur.

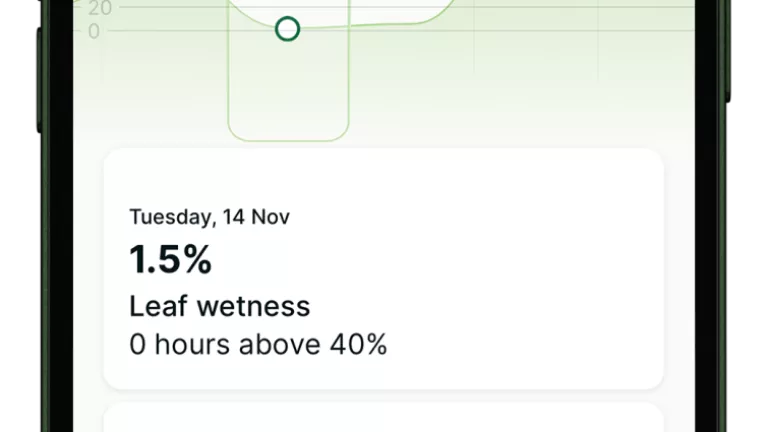
Leaf wetnessDollar spot thrives in prolonged periods of leaf wetness – particularly when roots are dry. Turf Advisor gives an indication of potential wet leaves, but be aware that irrigation or local conditions could also influence duration.
Leaf wetness

Dollar spot thrives in prolonged periods of leaf wetness – particularly when roots are dry. Turf Advisor gives an indication of potential wet leaves, but be aware that irrigation or local conditions could also influence duration.

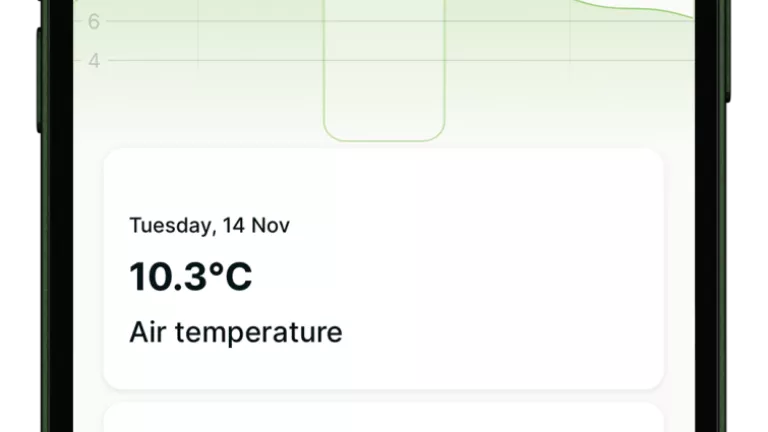
Air temperatureTemperature is one of the main influences of dollar spot infection. Although the information is built into the Smith-Kerns model, the actual data helps quantify risk pressures. Review the past week's figures for what is happening now.
Air temperature

Temperature is one of the main influences of dollar spot infection. Although the information is built into the Smith-Kerns model, the actual data helps quantify risk pressures. Review the past week's figures for what is happening now.

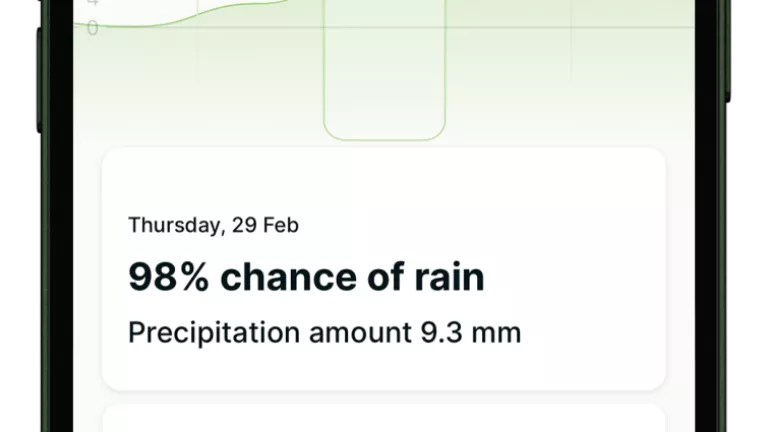
RainfallKeep track of recent rainfall and accurate forecasts for the coming days. Get an instant view of average data for the past two weeks, and compare to historic 10-year records for your current two-week period.

Rainfall

Keep track of recent rainfall and accurate forecasts for the coming days. Get an instant view of average data for the past two weeks, and compare to historic 10-year records for your current two-week period.

EvapotranspirationDry soils are associated with more severe outbreaks of dollar spot, particularly where turf is under other stress. Turf Advisor forecasts of evapotranspiration can help to manage and mitigate any deficits earlier and more effectively.

Evapotranspiration

Dry soils are associated with more severe outbreaks of dollar spot, particularly where turf is under other stress. Turf Advisor forecasts of evapotranspiration can help to manage and mitigate any deficits earlier and more effectively.

Smith Kerns modelRecognised as the most accurate available model for dollar spot risks, Turf Advisor indicates pressure over the past week and for the coming days – to help you assess risk. Also gives a two-week average and a historical risk to aid better decision making.

Smith Kerns model

Recognised as the most accurate available model for dollar spot risks, Turf Advisor indicates pressure over the past week and for the coming days – to help you assess risk. Also gives a two-week average and a historical risk to aid better decision making.
Dollar spot dashboardFind out how each of the data sets you can select influence dollar spot development and your decision making
HumidityHumidity is one of the key drivers for dollar spot outbreaks. You can set the risk threshold in Turf Advisor for 70% (medium) 80% (high), show in amber/red when the most challenging periods occur.
Leaf wetnessDollar spot thrives in prolonged periods of leaf wetness – particularly when roots are dry. Turf Advisor gives an indication of potential wet leaves, but be aware that irrigation or local conditions could also influence duration.
Air temperatureTemperature is one of the main influences of dollar spot infection. Although the information is built into the Smith-Kerns model, the actual data helps quantify risk pressures. Review the past week's figures for what is happening now.
RainfallKeep track of recent rainfall and accurate forecasts for the coming days. Get an instant view of average data for the past two weeks, and compare to historic 10-year records for your current two-week period.
EvapotranspirationDry soils are associated with more severe outbreaks of dollar spot, particularly where turf is under other stress. Turf Advisor forecasts of evapotranspiration can help to manage and mitigate any deficits earlier and more effectively.
Smith Kerns modelRecognised as the most accurate available model for dollar spot risks, Turf Advisor indicates pressure over the past week and for the coming days – to help you assess risk. Also gives a two-week average and a historical risk to aid better decision making.
Get your dollar spot dashboard cheat sheet

Quick link to download an easy to follow guide for your dollar spot dashboard

Download Turf Advisor

Quick link to download an easy to follow guide for your dollar spot dashboard